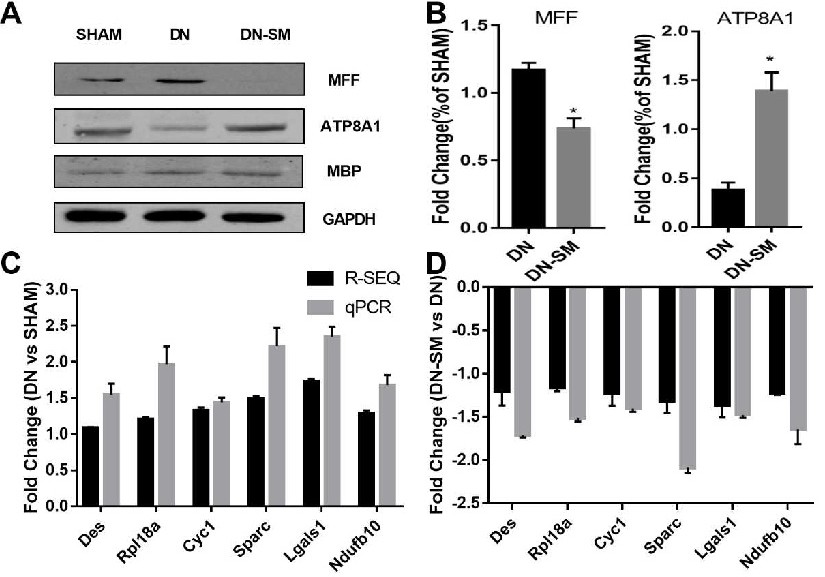
Fig. 5. Western blot and qPCR verification of differentially expressed proteins and genes. (A) Western blot results showing the expression of MFF, ATP8A1, and MBP in the three groups; GAPDH was used as the loading control and MBP was used as a negative control. (B) Statistical analysis of the intensity of the bands (DN-SM vs DN, n = 3). (C and D) qPCR validation of six randomly selected genes from the 402 DEGs, including Des, Rpl18a, Cyc1, Sparc, Lgals1, and Ndufb10; the trends in expression of mRNA detected by qPCR were similar to those detected by RNA-seq.